Create a View
Create a View
In this lesson we combine external data on energy prices, which was obtained from the SAP Data Marketplace of SAP Datasphere, together with our internal cash flow statement actuals and create a consumable view.
1. Acquiring Data from SAP Datasphere
First, let us navigate to the Data Marketplace. As the name suggests, it is like a marketplace for data consumers and data providers, and allows the easy integration of external data. If this is news to you, feel free to explore the various data products that are available.
-
Click on Data Marketplace from the side menu and select Landing Page.

-
You can now search for any data products available for example type Energy Data into the search field. You will see several data products listed.

- Select any one of these and read through the description. Notice there are various categories assigned which improve its visibility in the search, and some are accessible for free.
Note: In this academy we will not extract any data from SAP Data Marketplace as this step has been performed for your convenience. The relevant energy data has been extracted and stored in local tables in SAP Datasphere. We will reference this data in the next steps.
2. Combining data and creating a consumable view
We will now create an Analytical Dataset in SAP Datasphere, which combines external energy data from Data Marketplace with internal actuals.
To do so, let us create a new graphical view and union the Energy_Prices table with our actuals data in table T_S4_ACT.
-
Click on Data Builder.

-
Select Views and click New Graphical View.

-
In the Repository tab, search for table T_S4_ACT and drag and drop onto the canvas.

-
Then search for the Energy_Prices table from the same location and drag and drop it over the first table on the canvas. SAP Datasphere will suggest three options (UNION, JOIN or REPLACE) when you hover over the table, in this case you will select the UNION option.

Note: SAP Datasphere has already intelligently mapped all columns from the first table to those columns from the second table with the same business name. You will need to manually map both sides only for the version column.
- Select the Union node on the canvas. Then under mappings in the side panel, drag and drop VersionVersion onto Version.
The result should look like this:


Ignore any yellow warning message on the Union. This is due to a minor mistake in the data product for the energy prices and will not have any negative effect going forward.
Finally, let us navigate to the Output node and define the view properties.
- Click on the Output node View 1 and adapt the following:
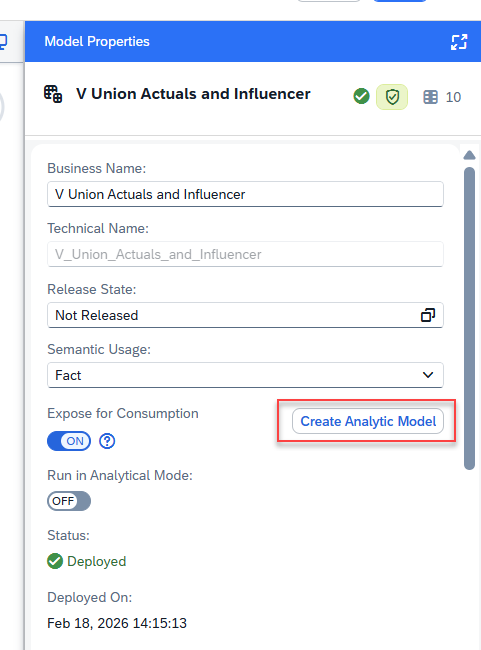
- Business Name: V Union Actuals and Influencer
- Semantic Usage: Fact
- Expose for Consumption: Enabled
- Measures: Amount (you can select this from Attributes and use the option “Change to Measure”)
- Attributes: All remaining columns

-
Now let’s deploy the Fact table. Click on the Deploy icon in the toolbar.

-
The Save View window will appear after clicking Deploy. You can leave the Business Name and Technical name as they appear by default, then click Save.

-
After a few moments the Status will change to Deployed.

-
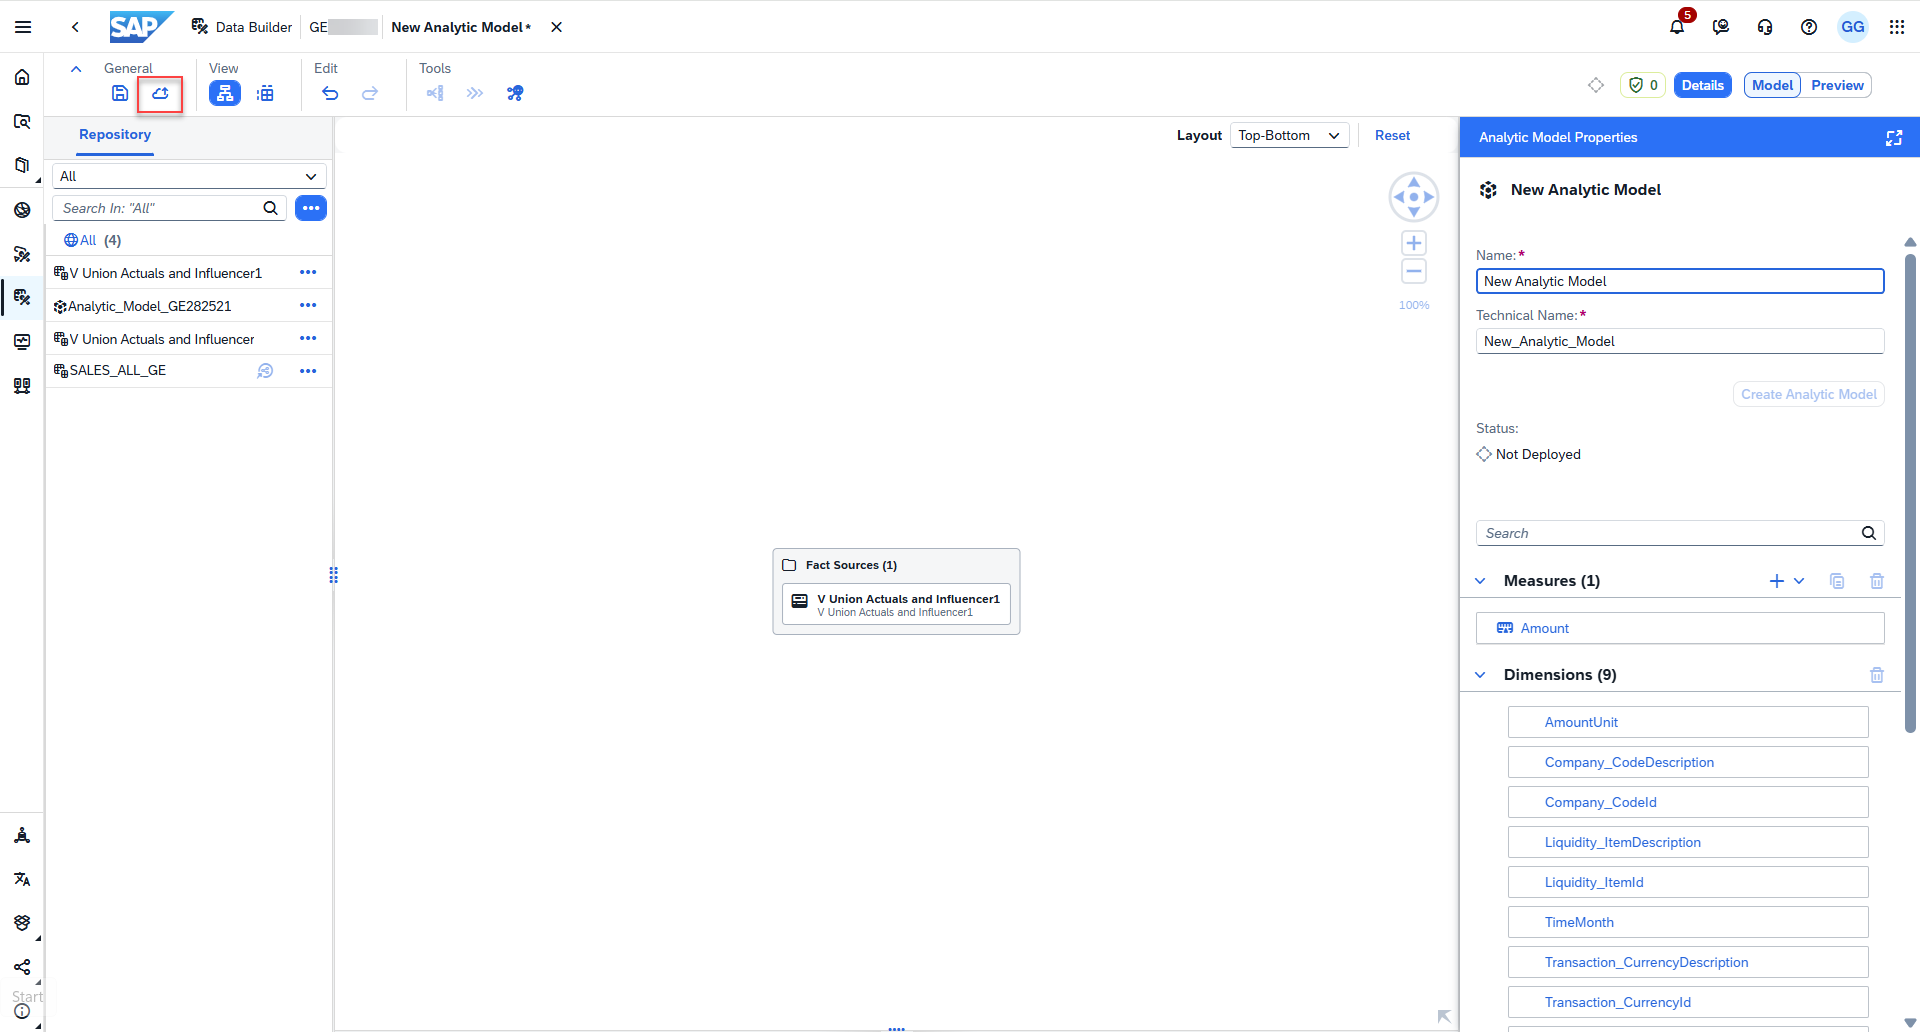
Click Create Analytic Model.
-
Click Deploy to deploy and save the analytic model.

-
Enter Analytic_Model_<your_ge_username> in the Business Name field and click Save.
-
Once the analytic model is deployed, continue to the next lesson.
Summary
You have now successfully created a consumable view in SAP Datasphere. Let us now navigate to SAP Analytics Cloud.