1. What is the time scope of learning and certification activities included in the dashboard?
The following outlines the timeframes for available data:
- Learning activity records:
Cover the last two years. - Certification activity records:
Cover the last ten years. - Data updates:
Typically, are reflected in the dashboard within 48 hours after the activity occurs.
2. How to find the list of learners with an SAP Learning Hub license?
- In the SAP Learning Hub analytics dashboard navigate to the Explore and Export Data section by clicking the respective button and then navigate to the Learners view.
- Make sure that the default filter criteria Learner Status= “Registered” is applied:
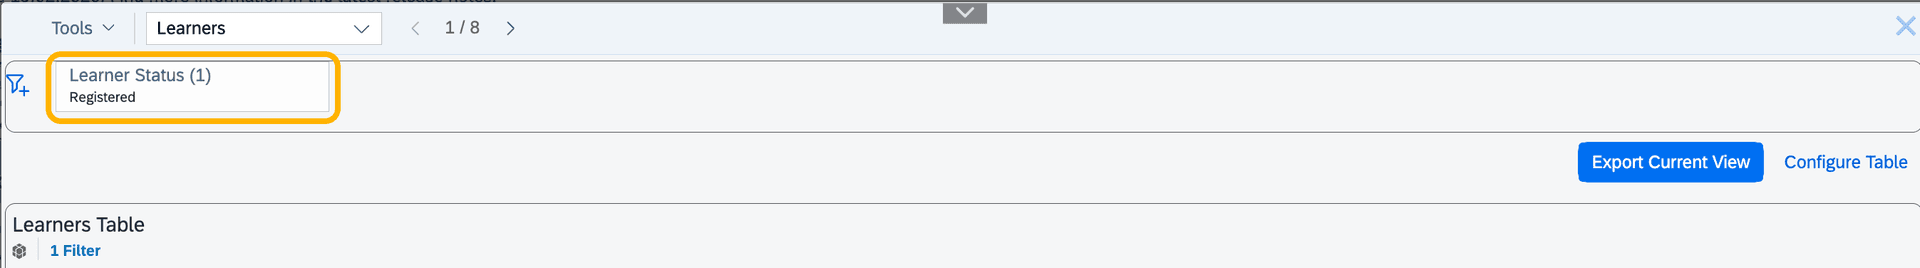
3. In the result list, you’ll see all learners that hold an active SAP Learning Hub license. You can export the list by pressing Export Current View button:

If you want to identify the learners that have a recent Stay Certified due date and don’t hold a valid SAP Learning Hub license, you will need to manually combine the list of learners with a SAP Learning Hub license and the list of learners who need to take a delta assessment to stay certified How to identify learners who need to take a delta assessment to stay certified
Watch the dedicated video on how to find learners whose certificates would expire soon and miss an SAP Learning Hub license.
3. How to identify users who have “License Manager” and/or “Learning Analyst” roles assigned?
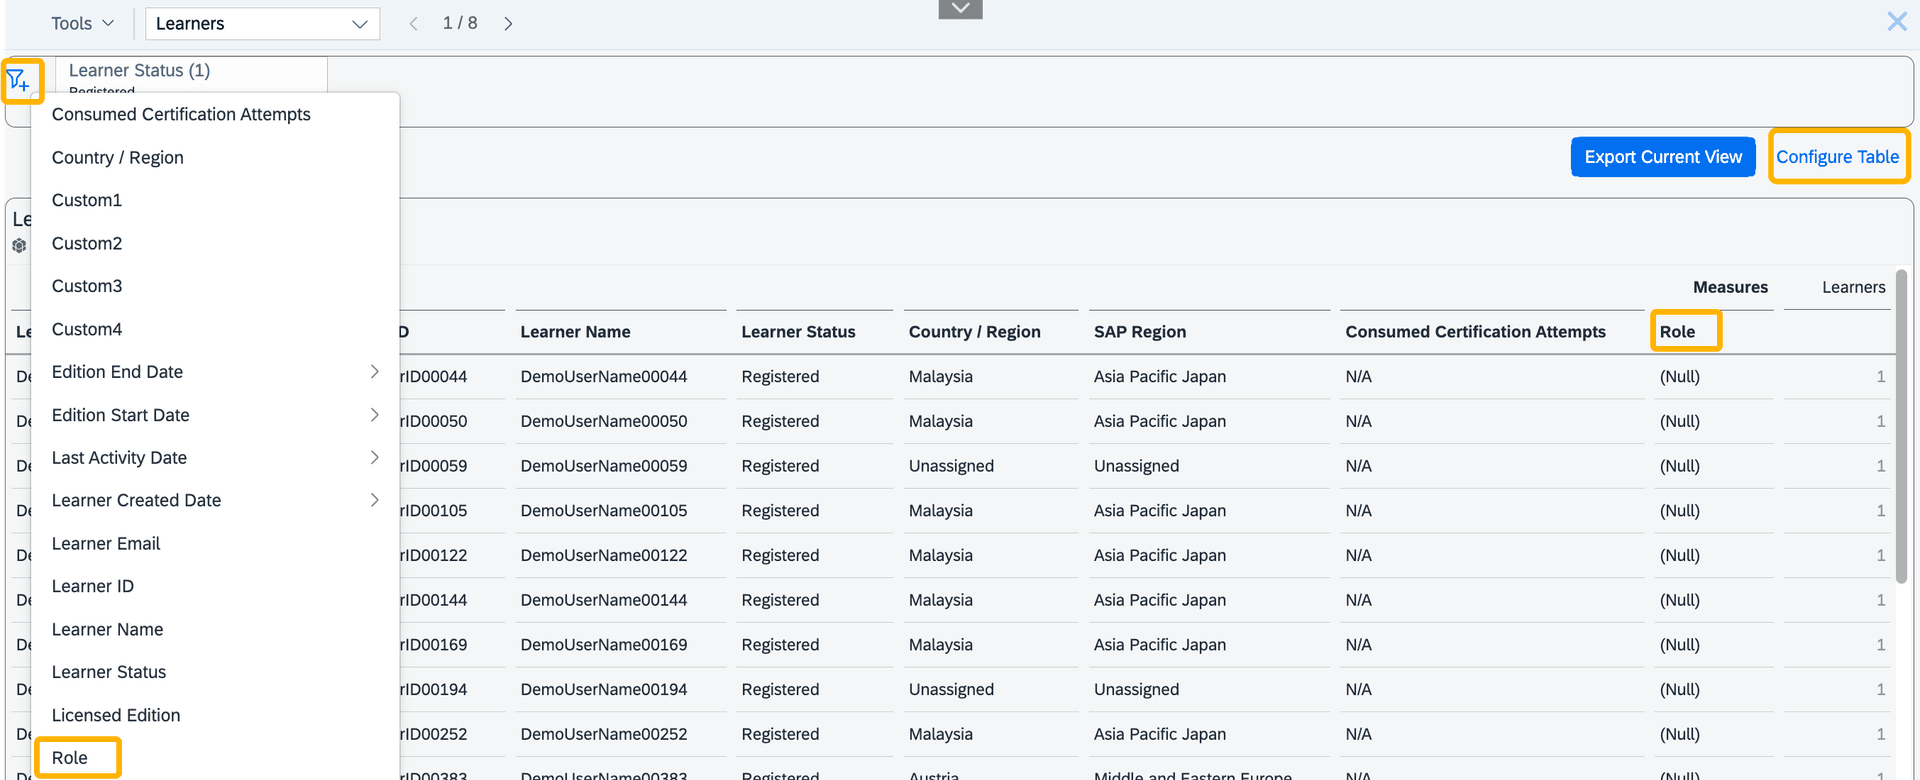
In the Learners view in the Explore and Export Data section we provide visibility to users that have administrative roles, even if they don’t have an active SAP Learning Hub license.
The field Role identifies users who are:
- License Manager:
can manage licenses and custom fields in the license management tool. - Learning Analyst:
can access the SAP Learning Hub analytics dashboard and export/analyze data.
Consider that the field is hidden by default from the table view and to use it, add the Role dimension via the Configure Table panel or include it as a filter by using the Filter line:
Notes:
- The Role field is populated only for users with administrative roles.
- Users with administrative roles may not have an SAP Learning Hub license, so license-related fields may be empty.
4. How to leverage custom fields to filter analytics data for a specific group of learners?
License managers can assign up to four Custom fields per learner when leveraging the self-service SAP Learning license management tool. If you aren’t using the tool yet, please contact our support team to process the update. The Custom fields are reflected as part of the data in the majority of the views in the Explore and Export Data feature. As a result, you can easily segment and report on learning activities for distinct groups: whether by department, location, or another categorization that suits your organization’s needs.
The Custom fields are hidden by default from the table view and to use them, add the dimensions via the Configure Table panel or include them as filters by using the Filter line:

5. How to track learners' engagement?
The dashboard provides measures that aggregate data from both the SAP Learning Site and SAP Learning Hub content library. This single view helps you easily monitor license usage and learner engagement across platforms. To determine if learners are making use of their assigned Learning Hub licenses, you have several options:
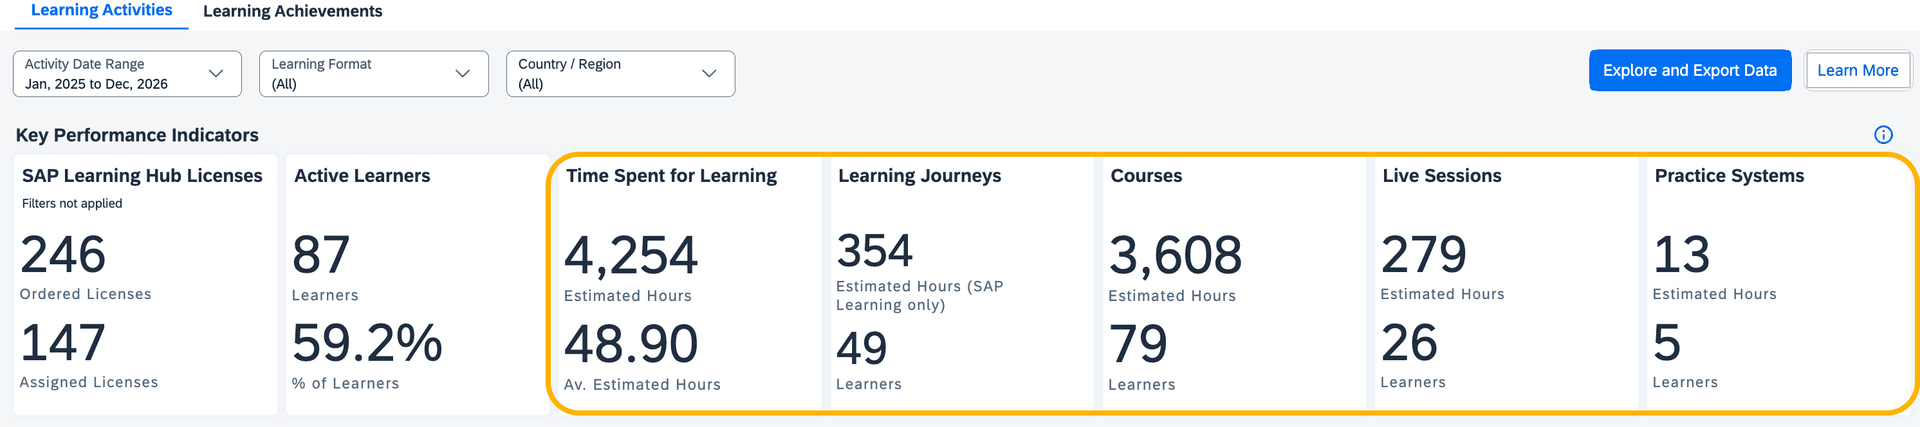
- The KPIs section on the Learning Activities page provides an overview of total Ordered and Assigned Licenses, the total number of Active Learners for the selected time period, and the Percentage of Active Learners across both SAP Learning Site and SAP Learning Hub content library.

- For more granular insight into individual activity, the Last Activity Date dimension in the Learners view of the Explore and Export Data feature reveals the date on which each learner most recently engaged with SAP Learning. This field takes into account learning activity both in the SAP Learning Site and the SAP Learning Hub content library. Furthermore, it includes engagement in all learning activities including Practice Systems and Live Sessions, so you can be confident that any type of participation is tracked.

- For a deep dive into learners' activity per date, you can leverage the dedicated views on the Explore and Export Data section.
6. How to measure time spent learning?
Assessing the time investment of your learners is possible through a combination of dashboard insights and detailed data exploration.
- The KPIs section on the Learning Activities page provides a quick overview of total and average estimated hours, plus detailed breakdowns by learning type (Learning Journeys, Courses, Live Sessions, Practice Systems) and number of engaged learners.
- For a more detailed or individual-level analysis, you can leverage the Estimated Hours and Learners metrics. These are available in the dedicated views of the Explore and Export Data section: Learning Journeys, Courses, Live Sessions, Practice Systems, and All Learning Activities. See How to customize your Data Table? for details.
By examining these data points, you can understand patterns in learner engagement and proactively support those who may need encouragement.
7. How to interpret estimated hours?
For most of the learning activities actual time spent can’t be tracked with precision and is subject to technical limitations. This is why the reporting is focused on Estimated Hours that provide the usual time for completing a learning activity.
- Course:
Typically, a course consists of units, and each unit consists of lessons and a quiz. If a learner completes a lesson, its duration will be reflected in the Estimated Hours measure for the respective Activity Date. So even if a course is "In progress" Latest Status, there could be estimated time recorded, if a lesson was completed. If a course is "Completed" and a lesson is passed again, Estimated Hours will increase, but the Latest Status will remain "Completed". Note that currently there is no estimated duration assigned to quizzes, and this results in rows in the dashboard that may show an activity for a particular date without any Estimated Hours. - Learning journeys that lead to outcome:
no Estimated Hours are recorded, as they are already recorded on the underlying courses. - Live sessions and recordings:
the full learning duration is recorded when the session/recording was watched for a minimum 5 minutes or 5% of the full length (the exact criteria differ for some of the events). Otherwise, no time is recorded. No Estimated Hours are recorded for assignment or registration. - Practice systems:
are the only learning type for which actual time spend is recorded. It is however, still displayed in the same measure Estimated Hours to simplify reporting. No duration is recorded for assignments or registration.
8. How to track a learner’s course progression and completion?
- The Activity Date shows when a learning activity occurs. If you are interested when a learner started a course, you need to consider the first Activity Date per learner per course

- We provide the Latest Status dimension for each learning object - as soon as a course is completed, the Latest Status value is updated. If the Latest Status is "Completed", the most recent Activity Date typically reflects the completion date. However, this may not be accurate if the learner has repeated the same learning item after completing it.
9. How to find the total duration of a learning item per learner?
To understand the duration of a specific user and learning do:
- Go to All Learning Activities view of the Explore and Export Data section.
- Filter for the Learner and for the Learning ID you’re interested in.
- Expand the selection for the Activity Date filter.
- Click on Configure Table button and add the Activity Date dimension.

The result table will display one or multiple entries for a specific Learner/Learning item. The first date is initial learning date and the last one if Latest Status is “Completed”, the last learning date. The sum of the Estimated Hours is the total duration.
10. How to get Country/Region-specific views?
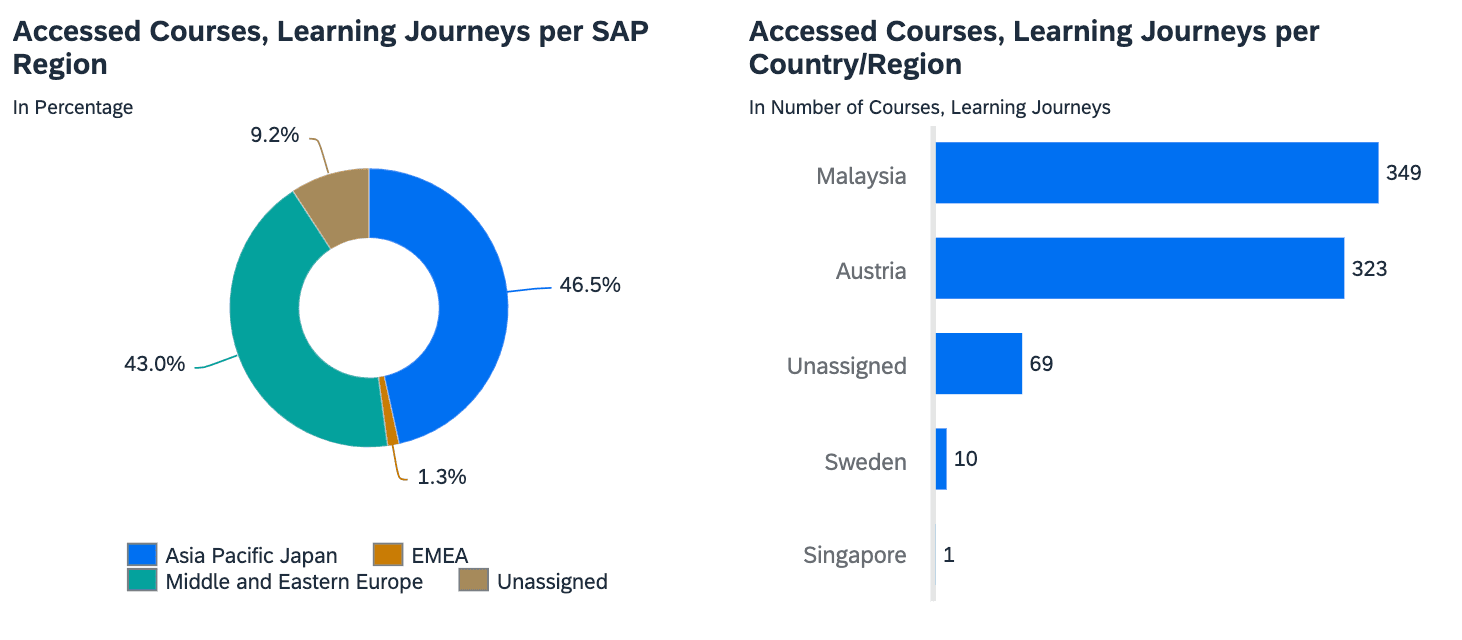
- There are several charts on the Leaner Engagement and Learner Activities per Learning Format sections that display data split by Country / Region, allowing for geographic analysis of learning activity:
- Additionally, you can use the dedicated page filter to select specific Country / Region and view the dashboard data accordingly. Please note, filtering directly on individual charts is not supported for this dimension and all filtering should be done through the main page filter.
- When working with Explore and Export Data feature, you can use the Country/Region and SAP Region, Universal ID Country / Region and Universal ID SAP Region dimensions to further refine your analytics to the desired geographic scope. Alternatively, you may use the custom fields. See How to leverage custom fields to filter analytics data for a specific group of learners? for details.